Home › Michigan Lake Levels › Lake Michigan
Lake Michigan Water Level Today
Michigan (also Wisconsin, Michigan, Indiana) · Official data from the NOAA Tides & Currents
Water level today · September 28, 2026, 4:06 PM EDT
Normal for the date
−0.1 ft from the typical level for this date
579.48 ft above sea level
- Past 7 days
- —
- vs 1 year ago
- +0.6 ft
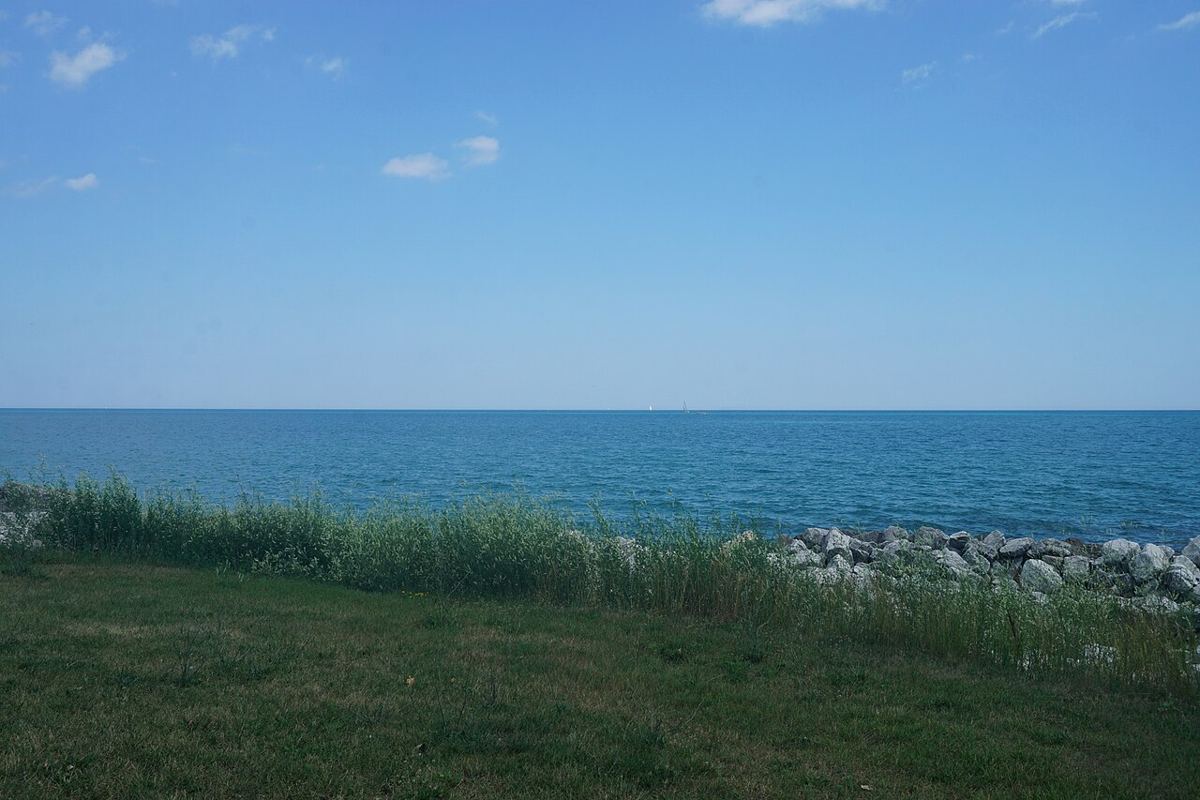
.jpg)
What do these numbers mean?
- Water level
- The height of the lake surface in feet above sea level, as measured by the official gauge.
- Normal for the date
- The typical (median) level on this calendar date across 2006-2025. The normal range is where the lake stood in 8 of 10 years.
Lake Michigan water level chart (last 2 years)
How is Lake Michigan changing?
One year ago the lake stood at 578.9 ft, so it is +0.6 ft compared with the same day last year.
Is Lake Michigan above or below normal?
For September 28, the normal level is about 579.6 ft (the normal range is 577.3 ft to 581.4 ft). Today's level is −0.1 ft compared with normal, within the normal range.
“Normal” here means the median level recorded on this calendar date across 2006-2025. Many reservoirs are drawn down on purpose in fall and winter, so a level below full pool can still be completely normal for the season.
Recent history
| Highest daily level (last 2 years) | 580.16 ft | August 2, 2026 |
| Lowest daily level (last 2 years) | 577.16 ft | December 20, 2025 |
| Same day last year | 578.86 ft | +0.6 ft vs today |
Frequently asked questions
- What is the water level of Lake Michigan today?
- The latest reading is 579.48 ft above sea level, reported by the NOAA Tides & Currents on September 28, 2026 at 4:06 PM EDT.
- What is a normal water level for Lake Michigan at this time of year?
- Based on daily readings from 2006-2025, the typical (median) level for this date is 579.6 ft, and 8 out of 10 years fall between 577.3 ft and 581.4 ft.
- What were the highest and lowest levels in the last two years?
- The highest daily level in the last two years was 580.2 ft on August 2, 2026; the lowest was 577.2 ft on December 20, 2025.
Where this data comes from
The water level is published by the NOAA Tides & Currents (station 9087044) and refreshed on this page every day. Full pool comes from the operator; the normal range is calculated from official daily readings for 2006-2025. Recent readings are provisional and may be revised. See data sources & methodology.